How a Remote SaaS Startup Used OxHRM to Fix Burnout, Missed Deadlines, and Payroll Leaks in 60 Days
The Startup: Fully Remote, Growing Fast, Quietly Breaking
“CloudStack Labs” (fictional name) is a 35-person SaaS startup with engineers, product managers, support, and sales spread across India and a few global locations. Everyone works remotely, and clients are mostly in the US and Europe.
By mid-2026, signs of trouble had appeared:
- Releases kept slipping, but founders had no hard data if estimates were wrong or if teams were overloaded.
- Some employees were close to burnout while others appeared underused, yet managers only saw the end result: missed deadlines.
- Payroll and effort did not align—salary costs were rising faster than delivered features and customer value.
- HR struggled to tie attendance, leave, and output together in any meaningful way.
They needed a way to see work, not just hours: whoʼs working on what, at what intensity, and with what impact.
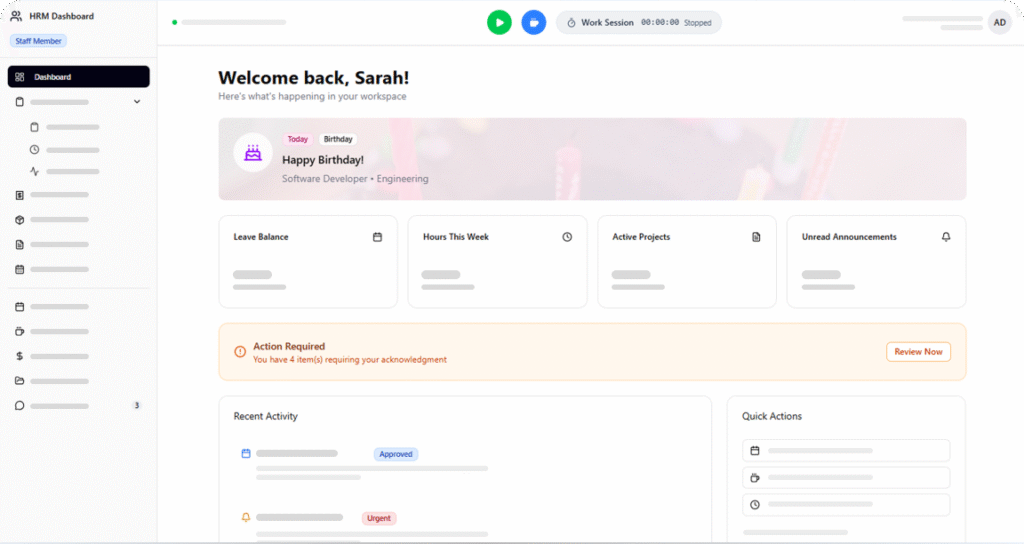
CloudStack Labs first moved all its HR basics into OxHRM
- Employee profiles, roles, and salary structures
- Attendance via web and mobile (for those who preferred not to use the desktop app always-on)
- Leave rules tailored for remote teams (flexible hours, but clear total capacity per week)
This gave them a single source for:
- Who is officially working and available
- Who is on leave or half-days
- How payroll and scheduled capacity line up month-by-month
Without this foundation, any productivity or burnout conversation would remain anecdotal.
Step 2: Deploying Desktop Time Tracking with Smart Guardrails
Next, they deployed OxHRMʼs desktop app across product, engineering, and support—not to micromanage, but to replace guesswork and messy manual timesheets.
They configured it to:
- Track active time by app and window, plus idle detection, so “8 hours logged” actually meant “8 hours of active use,” not just the laptop being on.
- Capture periodic screenshots during working hours, but with:
- No screenshots on explicitly marked “personal break” time
- Blurring of sensitive regions for teams handling customer data
Allow employees to see their own day timeline and screenshots, so they could self-audit-before managers ever got involved.
They also published a Remote Work & Monitoring Policy that clearly covered:
- What is tracked, when, and why
- Who can see raw screenshots and under what circumstances
- How data will (and will not) be used—for coaching and planning, not spying
This framing made adoption far smoother, because people understood the intent.
Step 3: Connecting Time Directly to Product Roadmap and Support Work
Using OxHRMʼs project management features, CloudStack Labs structured work around:
- Product Epics (modules/features)
- Sprints and tasks (engineering, QA, design)
- Support workloads (tickets grouped by client and severity)
Every tracked time block on the desktop app was mapped to a task under a project:
- Engineers tagged time to specific features or bugs.
- QA tagged to test cycles and regression rounds.
- Support agents tagged to ticket categories or key accounts.
This gave leadership, for the first time:
- Actual effort per feature and per sprint
- Real cost per module or client segment
- A clear picture of where time was being “burned” without visible impact
Step 4: Turning Data into Insight with AI HR Analytics
Once a few weeks of real data accumulated, CloudStack Labs began using OxHRMʼs analytics layer to spot patterns, not just totals.
They focused on three problem areas:
1. Burnout and Overload Signals
- AI models flagged individuals with consistent late-night and weekend activity, plus unusually high active time with little break usage.
- Cross-referencing with tasks showed they were often the “fixers” assigned to rescue late features.
Action taken:
- Redistributed critical fixes across more people
- Instituted a “no heroics week” each month where high-risk individuals were shielded from last minute escalations
- Introduced mandatory cool-down days after intense release cycles
2. Underutilization and Misaligned Talent
- Analytics highlighted a few engineers whose active time was low and fragmented across many small tasks, but rarely tied to roadmap-critical features.
- They werenʼt lazy—they were misallocated.
Action taken:
- Shifted them into focused ownership of specific modules
- Paired them with senior mentors on those modules
- Adjusted hiring plans (delayed one new hire because existing capacity was actually enough when properly focused)
3. Slipping Releases and Hidden Scope Creep
- For each sprint, OxHRM showed variance between estimated and actual hours, plus how much of the extra time was on “unplanned” work.
- Screenshots and app usage patterns confirmed a lot of time was going into customer-specific customizations that werenʼt on the roadmap.
Action taken:
- Introduced stricter rules on accepting one-off feature requests
- Created a separate “customer success engineering” lane with its own capacity, instead of stealing from product sprints
- Updated pricing and SLAs for custom work
Step 5: Linking It All Back to Payroll and Cost
Because HR, time, and projects sat in one system:
- Leadership could compare salary + overhead per role with actual, mapped output per month.
- They identified clients and features where effective hourly rates had sunk too low, and either-renegotiated contracts or reduced over-servicing.
- HR could justify promotions and raises with a mix of:
- Consistent utilization
- High-value project contributions
- Reliable attendance and collaboration
This transformed payroll from a static cost line into a strategic investment view.
The 60-Day Outcomes
Within two months of going live:
- Release slippages dropped because sprints were built on actual historic capacity, not wishful thinking.
- Burnout risk reduced—people still worked hard around major launches, but “perma crunch” was replaced by more balanced loads and clear recovery windows.
- Timesheet chasing stopped; time flowed automatically from the desktop app into projects and payroll.
- Leadership finally trusted the numbers, because screenshots + app usage + HR data made the picture coherent instead of fuzzy.
Most importantly, the founders had a defensible story for investors:
How You Can Use This Story in Your Marketing
You can adapt this article into:
- A “Customer Story” page on the OxHRM site
- A downloadable PDF case study for sales decks
- A LinkedIn carousel summarizing the before/after metrics
- Email drip content for prospects who care about:
- Remote/hybrid work
- Burnout
- Project slippage
- Accurate time billing
Table of Contents
Shafeeq Khan is a web developer who creates modern, responsive, and user-friendly websites with clean code and creative design
Latest Posts

10 Payroll Problems Killing Indian Startups (And HRMS Fixes That Work)
Problem 1: PF/ESI Registration Delays Issue: Startups hit 10+ employees but delay PF/ESI registration. Penalty: 25% interest + fines up...


Multi-State Payroll Calculator for Indian Startups (2026 Edition)
Why Every Startup Needs This Tool Indian startups now operate across states Jaipur HQ hires from Kota, remote workers from...

PF/ESI Audit Preparation Checklist for Indian Startups 2026
Why PF/ESI Audits Are Coming for You 2026 Reality: Labour inspectors now target startups with 10+ employees. Random audits, employee...